Well, we’re seeing a pick-up in number of sales for sure. The spring market seems to be upon us!
Average days on market was down about 13 days since the last report, which tells me that pricing is getting more accurate. Accurate pricing is imperative. It’s super obvious if an adjustment has to be made – and the sooner the better!
If you want a more detailed explanation of our current local market, reach out. Happy to help.
April 17, 2026:
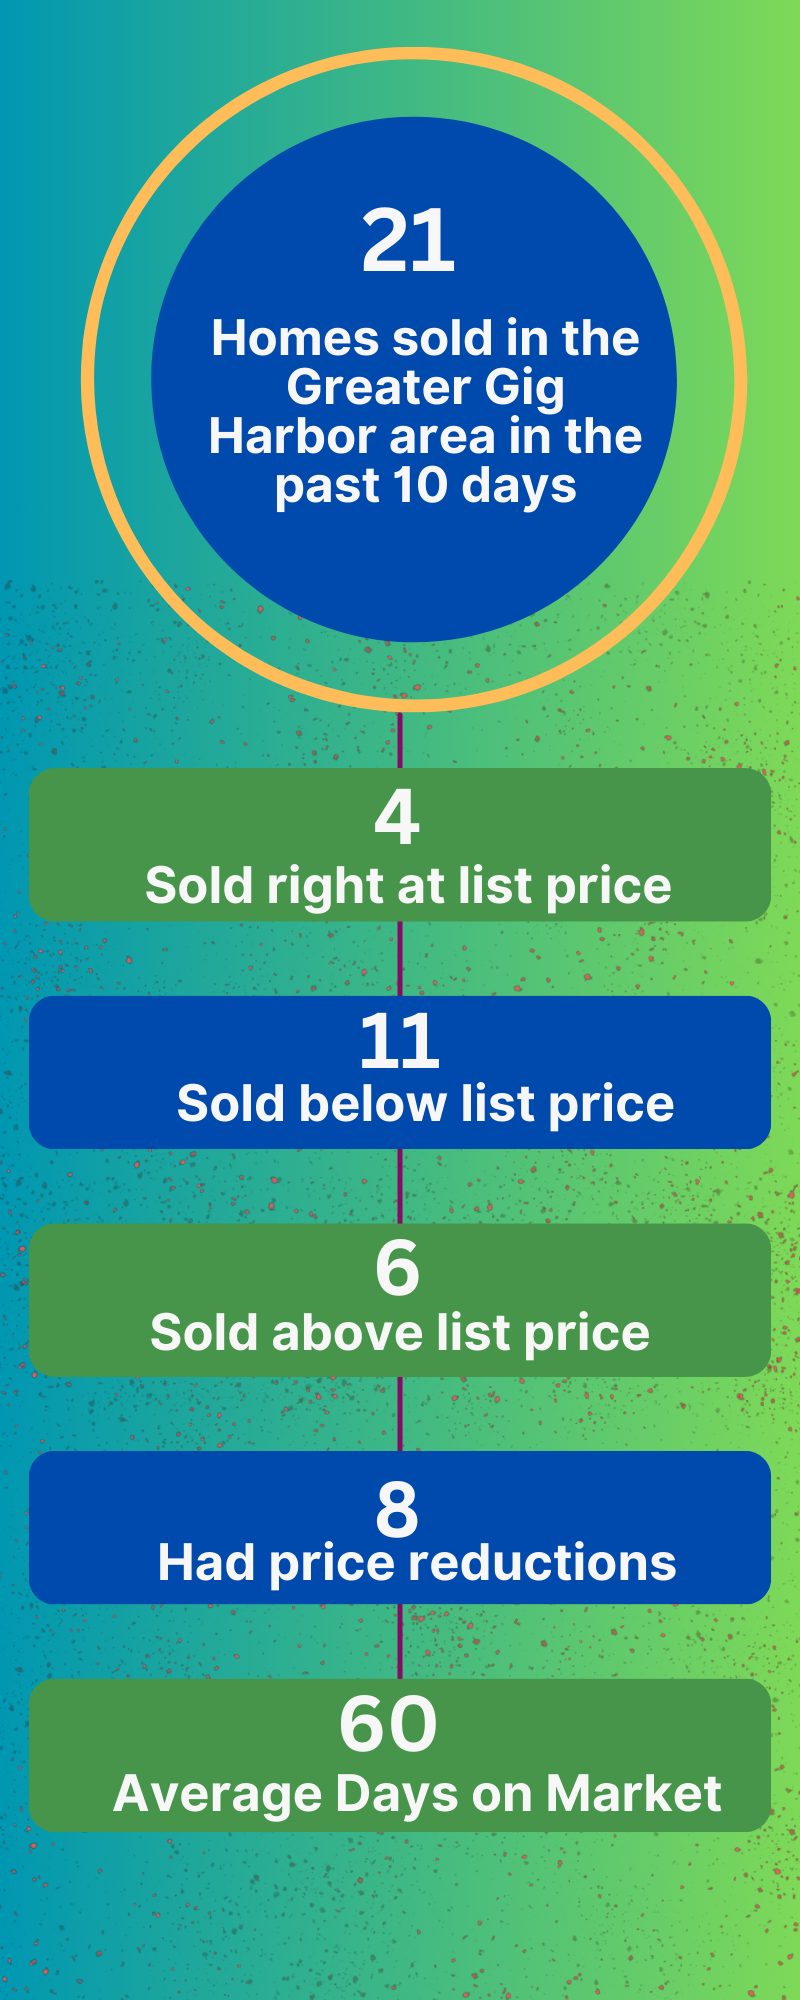
Some updated Gig Harbor statistics.
One for the month of March, one is a snapshot of current market conditions.
Things seem to be leveling out – there was very little contrast between the number of homes that sold above list price and those that sold below. And days on market decreased a bit, too.
Once again, the homes that lingered on the market tended to sell for less even after price reductions. It really is critical to get price right from the beginning. Depending on price range, this may NOT the same market we have had for the past couple of years.
Happy to help determine the right price whether you plan to buy or sell!
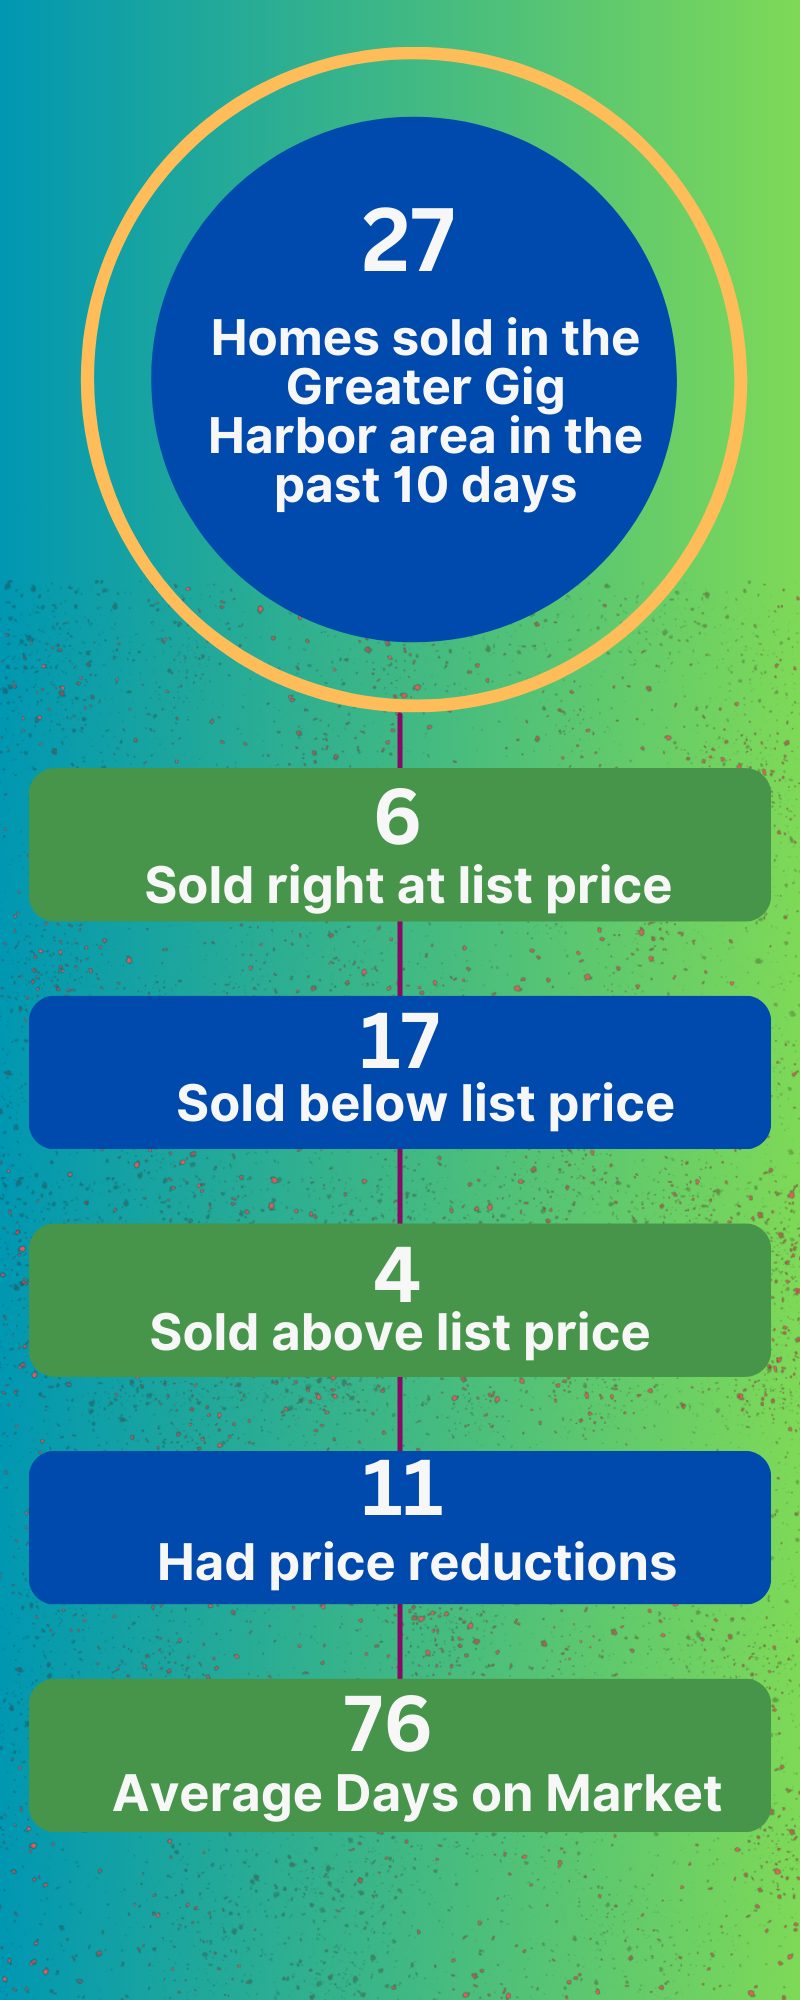
March 31, 2026:
Another 10 days of Gig Harbor home sales in the books!
There were 26 closings and days on market ranged from 6 to 332, with the average coming in at 61.
We’re still seeing a lot of price reductions, but the number of homes selling “at” and “above” list price is increasing. Sometimes it just takes a price correction to get back in the game!
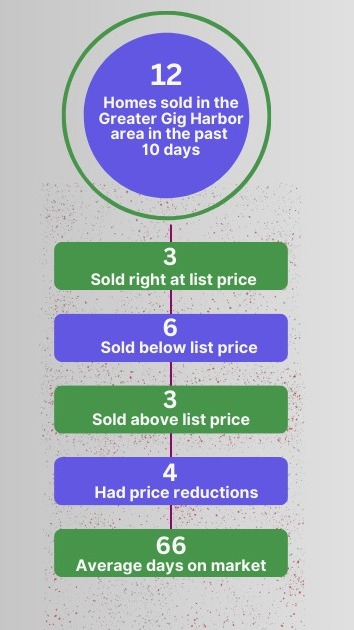
March 16, 2026:
Closings were down again over these past 10 days in Gig Harbor. This is a reflection of activity from about 30 days ago, so I guess more people were celebrating Valentine’s Day than buying homes.
What isn’t obvious from this graphic is that days on market varied from a low of 6 to a high of 216. And it’s no surprise that the homes that took the longest to sell sold for less than asking price. Over-pricing is a huge deal, but usually very obvious within the first 10-14 days, so correcting early is a huge deal, too.
I’m always happy to share what I know and research what I don’t know, so just reach out with any questions!
Closings were down over these past 10 days in Gig Harbor. This is a reflection of activity from about 30 days ago, so I guess more people were celebrating Valentine’s Day than buying homes.
What isn’t obvious from this graphic is that days on market varied from a low of 6 to a high of 216. And it’s no surprise that the homes that took the longest to sell sold for less than asking price. Over-pricing is a huge deal, but usually very obvious within the first 10-14 days, so correcting early is a huge deal, too.
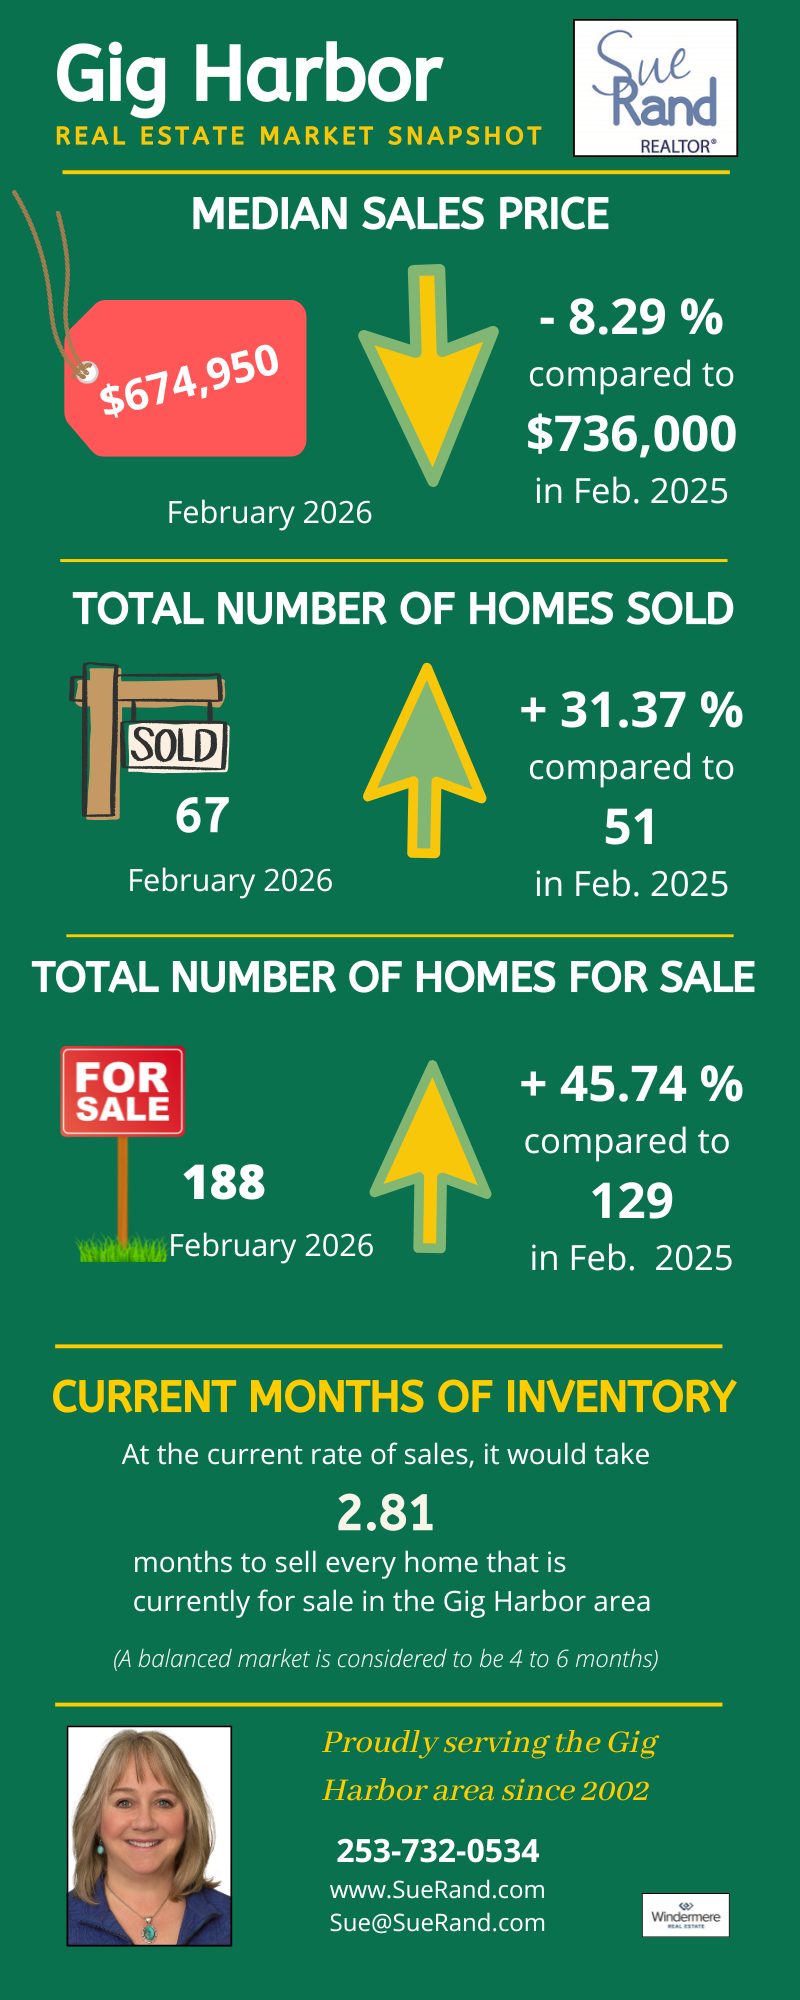
February was an interesting month. I had to dig a little deeper when I saw these numbers. As I broke down sales per price range, it was obvious why the median sales price came in at $674,950.
The $650-699K price range had 13 sales in February. That was by far the most active price range. The other most active price ranges had only 5 sales each.
Numbers don’t lie – they just need to be explained.
That’s what I’m here for… just reach out!
As we “ease” into March, here’s what we’re seeing. The overall February numbers will be in soon, but for now, it sure looks like the number of sales is increasing. Some of these have been on the market for months, but some have come and gone within days. Pricing and condition are everything!
A market snapshot taken on Feb. 18, 2026 showing recent activity. We’ve had a busy winter market so far. With a big spring market anticipated.
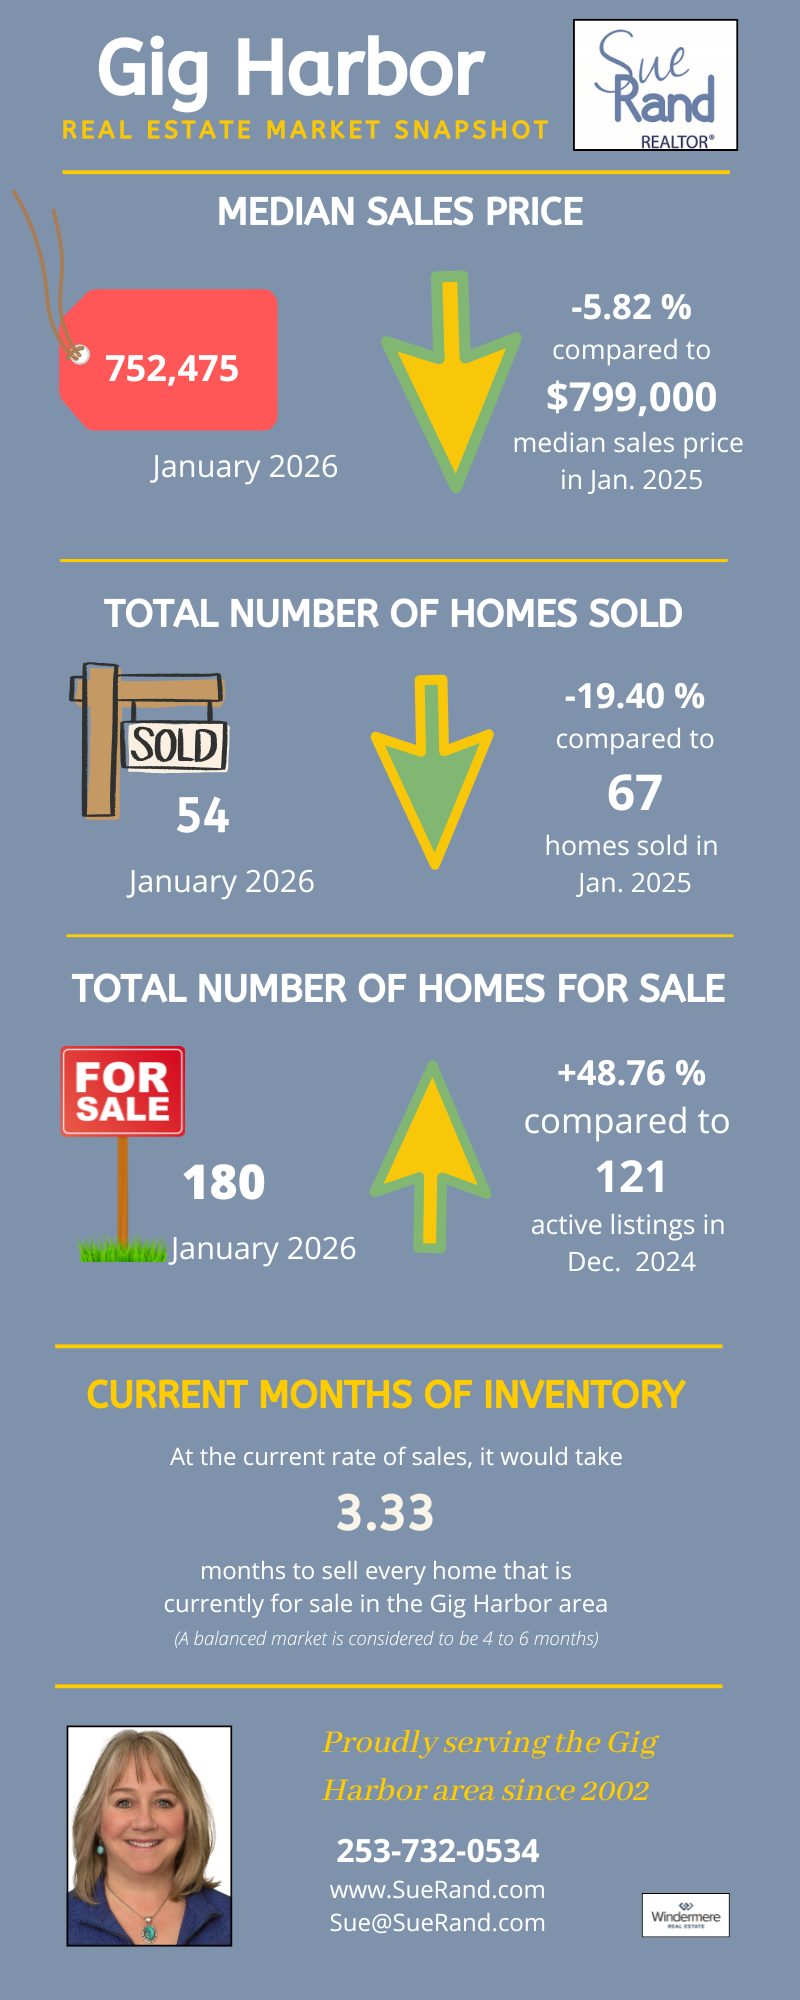
The first month of 2026 shows an increase in inventory from January of 2025, with median price and number of homes sold both down from last January. If you’re thinking about selling, it could be a good time for you. There’s a little less competition than we anticipate for the spring market. If you’re thinking about buying, take advantage of the lower prices while they last!
Feb. 3, 2026: This chart shows us that even though inventory is low, and sales are down, pendings are up, indicating good activity for this time of year.